Overview of kennebecRiverModel()
The purpose of this page is to provide a general overview of the Kennebec River dam passage performance standard model for American shad and blueback herring. If you are looking for examples, please check here.
Habitat definitions
The Kennebec River Model includes American shad and blueback herring habitat from Merrymeeting Bay upstream to Abenaki Dam and the Sandy River in the mainstem, and upstream of Burnham Dam in the Sebasticook River.
Hydro projects that can be assessed include Lockwood Dam, Hydro-Kennebec, Shawmut Dam, and Weston Dam in the mainstem, and Benton Falls and Burnham Dam in the Sebasticook River. The probability that fish use the mainstem or the Sebasticook River is determined stochastically, and is based on proportion of habitat in each of the migration routes.
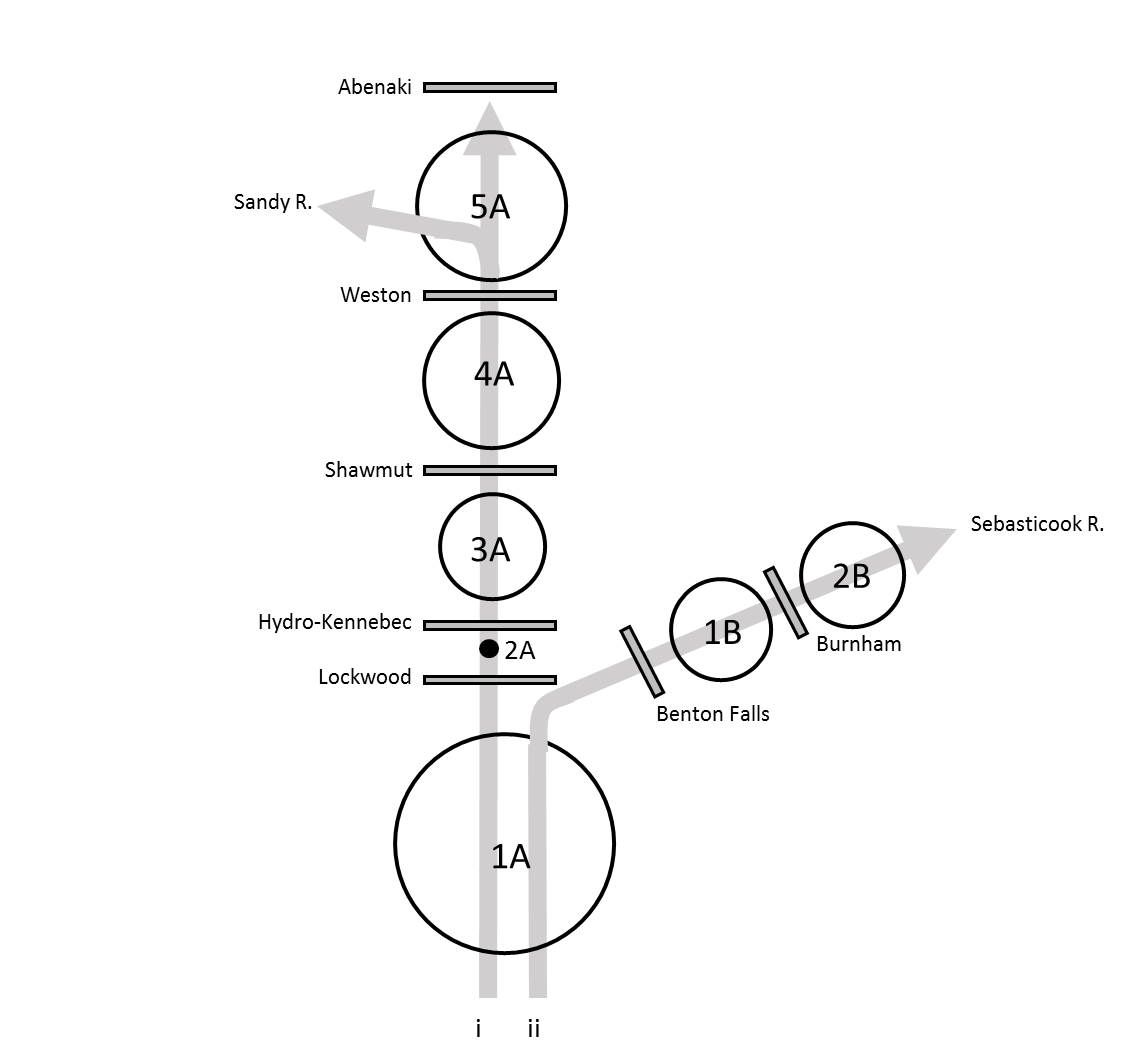
The river is split into two migratory routes at the confluence of the Kennebec River and its largest tributary, the Sebasticook River. A total of seven production units (PUs) are delineated based on dam locations in each route. The mainstem route includes PUs 1A, 2A, 3A, 4A, and 5A. The Sebasticook River route includes PUs 1A, 1B, and 2B. Abundances and carrying capacities are evaluated collectively in any shared PUs after the upstream migration model runs each year. The amount of habitat in each production unit is parameterized as ‘shad production’, and the circles in the diagram above are log-proportional to the amount of habitat. The only exception is in PU 2A, because there is no suitable spawning habitat between Lockwood Dam and Hydro-Kennebec.
Carrying capacity in the Kennebec River is based on number of adult spawners per unit surface area of habitat, an approach that is widely used for New England Rivers, but that is also highly uncertain. As in other applications, we assume a carrying capacity of about 100 fish per acre (or 200 fish per ha). Because of the uncertainty associated with these values here and elsewhere, this value is actually drawn from a distribution of values so sensitivity to assumptions can be assessed.
Environmental data
Historical temperature data are compiled from various locations in the Kennebec River watershed 2009-2018 by the Maine Department of Marine Resources in addition to data available from the SHEDS stream temperature database. Briefly, these sources include a total of 8 monitoring sites throughout the watershed. These data are used to simulate new daily temperatures using the simTemperature() function in shadia, for example:
library(shadia)
library(ggplot2)

# Simulate new temperatures for a single year
  newT <- simTemperature(setUpTemperatureData(river = "kennebec"))

# Plot the result
  ggplot(newT, aes(x = day, y = val)) +
    geom_line() +
    ylab(expression(paste('Temperature (', degree, 'C)'))) +
    xlab("Day of year")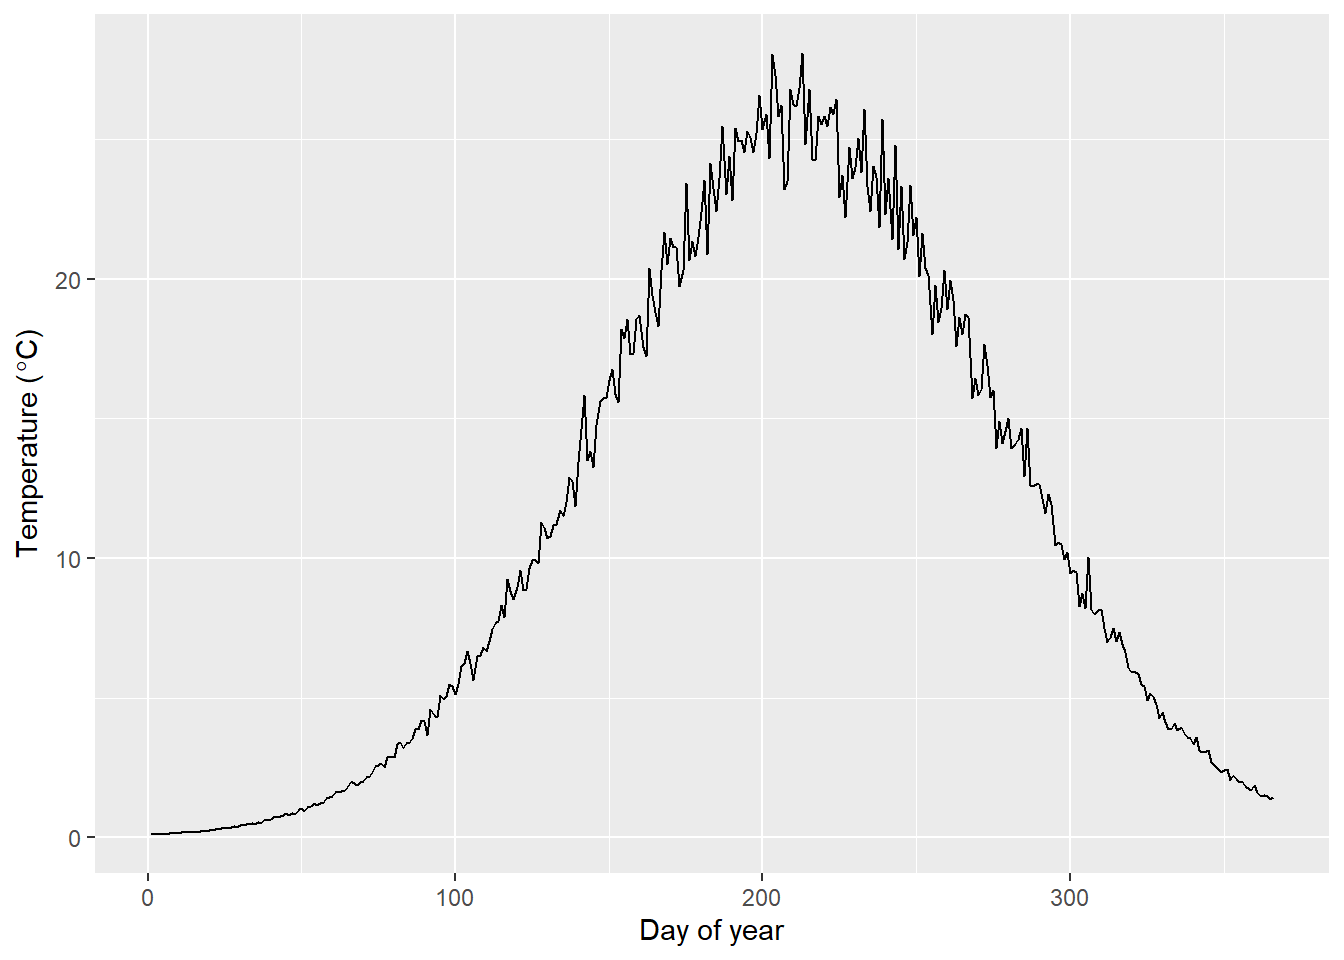
See ?shadia::tempData_kennebec in R for more information about the historical temperature data set for this system. Information about simulating new temperatures from existing data can be accessed by typing ?simTemperature and running in R.
Biological data
American shad
The majority of biological data and behavioral processes in shadia are conserved between systems to standardize the approach. Others are seeded initially and are derived from model observations as emergent patterns thereafter. However, each river system requires some river-specific biological data including maximum age, starting population sizes, and membership in life-history based ‘regions’ used to parameterize size at age and marine survival rates from coastal stock assessments.
The maximum age used for simulation in the Kennebec River is age 9 based on observed fish ages in other New England Rivers. The model is seeded with an initial age-1 abundance of about 0.2 million fish. Growth and marine survival inputs are parameterized using estimates for “Northern iteroparous” populations from Atlantic States Marine Fisheries Commission (ASMFC) 2020 American shad stock assessment. Growth and mortality are both projected from parameters of a von Bertalanffy growth function (VBGF) that includes effects of sea surface temperature on parameters L\(\infty\) and K. Marine survival and growth parameters are projected under RCP8.5 for this system using SST from the Northeast Continental Shelf Large Marine Ecosystem.
Blueback herring
Some species-specific data were used in parameterizing blueback herring models, although the majority of movement dynamics are the same as for American shad provided that 1) previously implemented dynamics were based on body lengths per second, and 2) similar data for blueback herring are currently lacking.
Species-specific life-history inputs from blueback herring in the Kennebec River include maximum age, cumulative probability of recruitment to first spawn, probability of repeat spawning, length-at-age and von Bertalanffy growth parameter estimates, and natural mortality estimates.
Maximum age reported by Maine Department of Marine Resources (MEDMR, unpublished data) was 7 years.
Cumulative probability of recruitment to first spawn from the same data set were 0, 0.01, 0.48, 0.90, 1, 1, 1 for ages 1 - 7.
Probabilty of being a repeat spawner at age was parameterized for ages 1-7 as: 0, 0, 0.004, 0.28, 0.83, 1, 1.
Parameters of the von Bertalanffy growth function (VBGF) were estimated from age and length data provided by MEDMR. Three VBGFs were fit using Bayesian hierarchical models in Stan software using Rstan. These included sex-aggregate, male-only, and female-only models. The full posteriors for log-scale parameters Linf, K, and t0 are stored in vbgf_kennebec_bbh_agg, vbgf_kennebec_bbh_m, and vbgf_kennebec_bbh_f. A description of the estimates can be accessed in R by typing ?vbgf_kennebec_bbh_... in the console and running, where ... should be replaced by agg, m, or f. Sex-specific lengths of simulated fish are drawn for each fish in each year by sampling one set of correlated VBGF parameters from the appropriate posterior to incorporate these correlations and avoid nonsensical pairing of simulated VBGF parameters.
Natural mortality (M) is estimated on a per-simulation basis (not per-year) from the sex-aggregated VBGF parameters using the modification of Pauly (1980) recommended by Then et al. (2015) when virgin maximum age of a stock is unknown.
This work is licensed under a Creative Commons 4.0 International License.