Overview of mohawkHudsonRiverModel()
The purpose of this page is to provide a general overview of the Mohawk-Hudson River dam passage performance standard model for American shad and blueback herring. If you are looking for examples, please check here.
Habitat definitions
The Mohawk-Hudson River Model includes American shad and blueback herring habitat from the Hudson River estuary upstream to Rome, NY in the Mohawk River and upstream to Hudson Falls, NY in the mainstem Hudson River.
Dams in this model are a mix of hydropower facilities and navigational canals. These include all mainstem dams in the Hudson River, and all canal dams in the Mohawk River and upper Hudson River. Upstream passage and downstream mortality can be assessed at each of these, collectively or individually. The probability that fish use the mainstem or the Mohawk River is included as a management decision, but may be input stochastically by the user.
Mohawk-Hudson River model schematic showing dams, migration routes, and production units:

The river is split into two migratory routes at the confluence of the Hudson River and its largest tributary, the Mohawk River. A total of 28 production units (PUs) are delineated based on locations of 26 dams throughout the watershed. The upper Hudson River route includes PUs 1A, 2A, …, 8A. The Mohawk River route includes PUs 1A, 2B, 3B, …, 21B. Abundances and carrying capacities are evaluated collectively in any shared PUs after the upstream migration model runs each year. The amount of habitat in each production unit is parameterized as surface area for both American shad and blueback herring.
Carrying capacity in the Hudson River is based on number of adult spawners per unit surface area of habitat, an approach that is widely used for New England Rivers, but that is also highly uncertain for both species. As in other applications, we assume a carrying capacity of about 100 fish per acre (or 250 fish per ha). Because of the uncertainty associated with these values here and elsewhere, this value is actually drawn from a distribution of values so sensitivity to assumptions can be assessed.
Environmental data
Historical temperature data are compiled from the US Geological Survey gage at Albany, NY (Gage ID 01359139). Briefly, these sources include a total of 8 monitoring sites throughout the watershed. These data are used to simulate new daily temperatures using the simTemperature() function in shadia, for example:
library(shadia)
library(ggplot2)

# Simulate new temperatures for a single year
  newT <- simTemperature(setUpTemperatureData(river = "hudson"))

# Plot the result
  ggplot(newT, aes(x = day, y = val)) +
    geom_line() +
    ylab(expression(paste('Temperature (', degree, 'C)'))) +
    xlab("Day of year")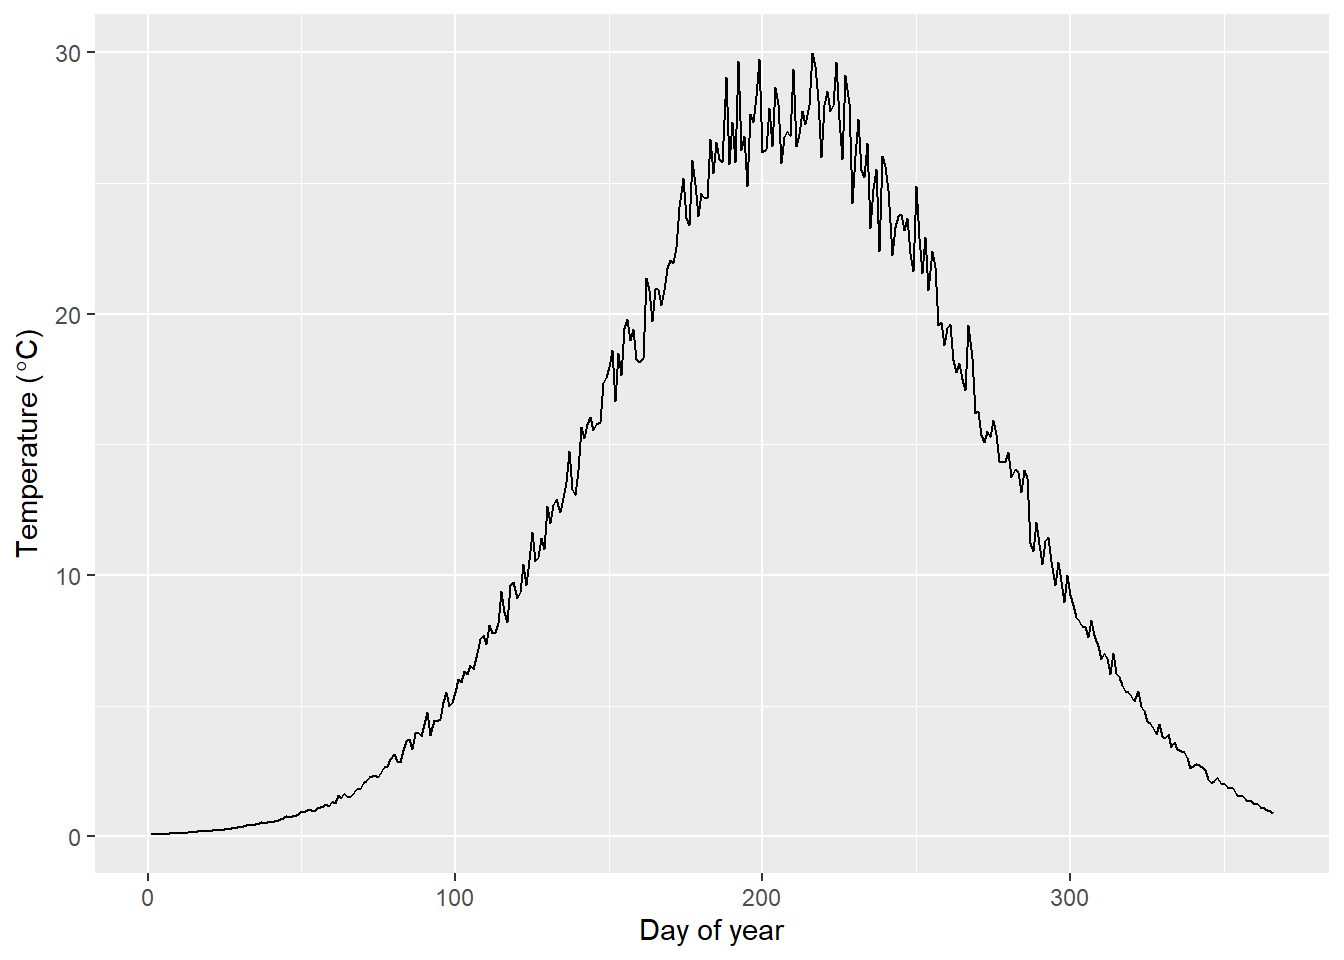
See ?shadia::tempData_hudson in R for more information about the historical temperature data set for this system. Information about simulating new temperatures from existing data can be accessed by typing ?simTemperature and running in R.
Biological data
The majority of biological data and behavioral processes in shadia are conserved between systems to standardize the approach. These are described in detail in Stich et al. (2019), in the source files for the R package, and in the help files for each function included. Others processes/parameters are seeded intially and are derived from model observations as emergent patterns thereafter (e.g. percent repeat spawners by age). However, each river system requires some river-specific biological data including maximum age, starting population sizes, and membership in life-history based ‘regions’ used to parameterize size at age and marine survival rates from coastal stock assessments.
American shad
The maximum age used for simulation in the Mohawk and Hudson rivers is age 9 based on observed fish ages in other New England Rivers. Growth and natural mortality inputs are parameterized using estimates for “Southern iteroparous” populations from Atlantic States Marine Fisheries Commission (ASMFC) 2020 American shad stock assessment and Gilligan (2020). Growth and mortality are both projected from parameters of a von Bertalanffy growth function (VBGF) that includes effects of standardized sea surface temperature on parameters L\(\infty\) and K under ‘current’ SST projected using RCP 8.5 (as of 2021).
Blueback herring
Some species-specific data were used in parameterizing blueback herring models, although the majority of movement dynamics are the same as for American shad provided that 1) previously implemented dynamics were based on body lengths per second, and 2) similar data for blueback herring are currently lacking.
Species-specific life-history inputs from blueback herring in the Hudson River include maximum age, cumulative probability of recruitment to first spawn, probability of repeat spawning, length-at-age and von Bertalanfy growth parameter estimates, and natural mortality estimates. Maximum age reported by New York State Department of Environmental Conservation (NYSDEC, unpublished data) is 9 years. Cumulative probability of recruitment to first spawn from the same data were estimated to be 0.000, 0.009, 0.480, and 0.904 for ages 1-4, and 1.00 for ages 5-9. Initial probability of repeat spawning at age was parameterized as 0.000, 0.000, 0.004, 0.208, 0.674 for ages 1-5, and was 1.000 for ages 6-9.
Parameters of the von Bertalanffy growth function (VBGF) were estimated from age and length data provided by NYSDEC. Three VBGFs were fit using Bayesian hierarchical models in Stan software using Rstan. These included sex-aggregate, male-only, and female-only models. The full posteriors for log-scale parameters Linf, K, and t0 are stored in vbgf_hudson_agg, vbgf_hudson_m, and vbgf_hudson_f. A description of the estimates can be accessed in R by typing ?vbgf_hudson_... in the console and running, where ... should be replaced by agg, m, or f. Sex-specific lengths of simulated fish are drawn for each fish in each year by sampling one set of correlated VBGF parameters from the appropriate posterior to incorporate these correlations and avoid nonsensical pairing of simulated VBGF parameters.
Natural mortality (M) is estimated on a per-simulation basis (not per-year) from the sex-aggregated VBGF parameters using the modification of Pauly (1980) recommended by Then et al. (2015) when virgin maximum age of a stock is unknown.
This work is licensed under a Creative Commons 4.0 International License.